
The traditional approach to risk management for regular investors is to use an equity/bond mix, such as the 60/40 portfolio—60% equities and 40% bonds. This has long been the go-to strategy for investors seeking a balance between growth and risk mitigation. The “age in bonds” rule—allocating a percentage of your portfolio to bonds equal to your age—is another classic guideline aimed at reducing volatility as you approach retirement. However, recent market events, particularly in 2022, have highlighted limitations in these time-tested approaches. Bonds, which traditionally offer stability, didn’t quite provide the safety net investors were counting on during that period. Meanwhile, buffer funds have emerged as a compelling alternative to risk management for regular investors. Despite having slightly higher management fees compared to simple index funds. Think of them as the innovative newcomers offering a fresh approach to balancing risk and return—perhaps the hybrid cars in a world accustomed to gasoline engines.
This article explores how buffer funds can serve as an effective substitute for the traditional equity/bond mix, highlighting their benefits—including potential tax advantages—and discussing their management fees. We’ll delve into the history and growth of buffer funds, provide specific examples from BlackRock and PGIM, and discuss alternative strategies that aim for similar goals.
The Limitations of the Traditional Equity/Bond Mix for Risk Management
Bonds Underperformed in 2022
- Rising Interest Rates: Central banks increased interest rates to combat inflation, causing bond prices to fall.
- Inflation Impact: Elevated inflation eroded the real returns of fixed-income investments.
- Correlation with Equities: Unusually, both stocks and bonds declined simultaneously, diminishing diversification benefits.
Implications
- Reduced Protection: Bonds did not provide the expected cushion during market downturns.
- Lower Yields: Persistently low interest rates led to low-income generation from bonds and once yield started to increase the bond prices started to decline.
Buffer Funds Overview
What Are Buffer Funds
Buffer funds, also known as defined outcome ETFs, aim to:
- Mitigate Downside Risk: Offer protection against market losses, sometimes up to a specific percentage or even 100% (minus fees).
- Participate in Market Gains: Allow for growth, often up to a predetermined cap.
How Do Buffer Funds Manage Risk
- Downside Protection: Provide varying levels of protection against market losses during a defined outcome period. The downside protection can range from a few percent all the way to 100%.
- Upside Potential: Gains are often capped to balance the cost of providing downside protection. The more protection, the more restrictive the cap will be.
- Outcome Periods: Protection and caps are tied to specific timeframes, resetting quarterly, annually, or monthly.
- Underlying Index: Typically linked to major indices like the S&P 500.
- Options Strategies: Buffer funds utilize options to structure the protection and potential returns.
How It All Started
- Back in August 2018, Innovator Capital Management kicked off the trend by launching the first buffer ETFs, bringing defined outcome investing to the world of ETFs.
- The Debut Funds:
- Innovator S&P 500 Buffer ETF – August (Ticker: BAUG)
- Innovator S&P 500 Power Buffer ETF – August (Ticker: PAUG)
- Innovator S&P 500 Ultra Buffer ETF – August (Ticker: UAUG)
- The Debut Funds:
Going Big and Getting Popular
- After 2018:
- New Players: Asset management big shots like First Trust, Allianz Investment Management, PGIM, and BlackRock jumped in with their own buffer funds.
- More Choices: Expanded to cover different indices, buffer levels, and outcome periods.
Why the interest in buffer funds
- Why People Like It: Tackled worries about market ups and downs and potential losses.
- Easy Access: Brought fancy risk management techniques to everyday investors through the ETF setup.
Considerations for Buffer Funds (pros and cons)
1. Downside Protection (the big selling point)
- Risk Mitigation: Offers protection against specific levels of market losses, providing significant risk reduction.
- Emotional Comfort: Reduces anxiety during volatile markets, encouraging investors to stay invested.
2. Participation in Market Upside
- Growth Potential: Allows for gains, which are typically capped. (No free lunch, you have to give something up for getting the protection)
- Inflation Hedge: Potentially better at keeping pace with inflation compared to bonds.
3. Tax Benefits
- Capital Gains Tax Treatment: Gains may be taxed at long-term capital gains rates, lower than ordinary income tax rates applied to bond interest.
- Tax-Advantaged Accounts: Can be held in IRAs or 401(k)s for tax-deferred growth.
4. Reduced Interest Rate Sensitivity
- Less Impact from Rising Rates: Buffer funds are less affected by rising interest rates than bonds.
5. Management Fees
- Expense Ratios: Buffer funds generally, have net management fees of 0.50% or more, as compared to simple index funds that often have expense rations as low as 0.1% or even lower. Over time even a small difference in expense ratio can add up.
- Cost vs. Benefit: Fees may be justified by the downside protection and growth potential offered. Especially for people close to or in retirement or people that know they might need the money in the near future.
6. Capped Upside Potential
- Missed Gains: In strong bull markets, returns beyond the cap are forfeited.
- Expectation Management: Investors should ensure the investment aligns with their financial goals and risk tolerance. This includes how they would feel about the market gaining 30% and they might only see a 10% gain due to the cap.
7. Complexity
- Understanding Strategies: The use of options and defined outcomes adds layers of complexity. However, as a retail investor it is sufficient to understand just the impact of the caps and protection, not the details of how it is achieved, that is taken care of by the fund managers.
- Investor Education: It’s crucial to understand how the fund operates before investing.
Buffer ETF’s summary
Displayed in table 1 are details of buffer funds offered by BlackRock and PGIM, along with references to their official information pages. If you want to do some back testing of your own, I can recommend the website ValueInvesting.io. Also check back for new blogs on this topic.
| Fund Name | Ticker | Issuer | Downside Protection | Upside Potential | Outcome Period | Expense Ratio |
| iShares Large Cap Deep Buffer ETF – June | MAXJ | BlackRock | 100% of losses (minus fees) | About 10-11% per year | Resets annually at end of June | 0.50% |
| iShares Large Cap Moderate Buffer ETF | IVVM | BlackRock | Buffers the first 5% of losses every quarter | Participation in gains up to cap of about 5% per quarter | Resets quarterly | 0.50% |
| iShares Large Cap Deep Buffer ETF | IVVB | BlackRock | Buffers up to 15% of losses after the first 5% of losses | Participation in gains up to cap of about 7% per quarter | Resets quarterly | 0.50% |
| PGIM Laddered Fund of Buffer 12 ETFs | BUFP | PGIM | Buffers the first 12.5% of losses | Participation in gains up to cap of about 12%/year | Resets monthly (laddered strategy) | 0.50% |
| PGIM Laddered Fund of Buffer 20 ETFs | PBFR | PGIM | Buffers the first 20% of losses | Participation in gains up to cap of about 15%/year | Resets monthly (laddered strategy) | 0.50% |
| PGIM Laddered Nasdaq-100 Buffer 12 ETF | PBQQ | PGIM | Buffers the first 12% of losses | Participation in gains up to cap of about 17%/year | Resets quarterly | 0.50% |
Alternatives to Buffer Funds
Buffer funds offer a unique mix of protection and growth potential. However, there are other strategies that aim to achieve similar goals. Keep in mind that these alternatives may require a deeper knowledge of investments and may not be as suitable for the average retail investor. See table 2 for a few examples and how they compare to buffer funds in terms of suitability for the typical retail investor.
| Alternative | Level of Knowledge Required | Suitability for Average Retail Investors |
| Buffer ETFs | Low to Moderate | High |
| Structured Notes | High | Limited |
| Annuities with Guarantees | Moderate to High | Variable |
| Option Strategies | High | Limited |
| Low-Volatility ETFs | Low to Moderate | High |
Explanation:
- Buffer ETFs:
- Level of Knowledge Required: Low to Moderate. While they involve complex instruments like options, the fund management handles these complexities internally.
- Suitability for Average Retail Investors: High. Designed to be accessible, offering downside protection and potential for growth without needing advanced investment knowledge.
- Structured Notes:
- Level of Knowledge Required: High. Requires understanding complex financial instruments and issuer credit risk.
- Suitability for Average Retail Investors: Limited. Complexity and potential liquidity issues make them more suitable for sophisticated investors.
- Annuities with Guarantees:
- Level of Knowledge Required: Moderate to High. Understanding terms, fees, and surrender charges is essential.
- Suitability for Average Retail Investors: Variable. Can be suitable for some, but complexity requires careful consideration.
- Option Strategies:
- Level of Knowledge Required: High. Involves complex strategies and significant risk.
- Suitability for Average Retail Investors: Limited. Generally, not appropriate without substantial knowledge or professional guidance.
- Low-Volatility ETFs:
- Level of Knowledge Required: Low to Moderate. Function like standard ETFs but focus on low-volatility stocks.
- Suitability for Average Retail Investors: High. Accessible and easy to integrate into portfolios, though they don’t offer explicit downside protection.
Incorporating Buffer Funds into Your Portfolio
Incorporating buffer funds into a portfolio can effectively balance growth and risk, similar to how investors adjust their bond allocations based on age. Younger investors typically allocate more to equities for higher growth potential. As they age and approach retirement, they can gradually shift a portion of their investments into buffer funds to protect against market downturns. This strategy maintains exposure to equity gains while providing downside protection, thereby reducing portfolio volatility over time. Buffer funds are particularly beneficial in low-interest-rate environments, offering better returns and tax treatment than traditional bonds while still mitigating risk. By increasing their allocation to buffer funds as they age, investors can tailor their risk exposure to match their evolving financial goals and risk tolerance. As with any investment strategy, it’s important to assess individual financial situations and consult with a financial advisor to ensure that integrating buffer funds aligns with overall investment objectives.
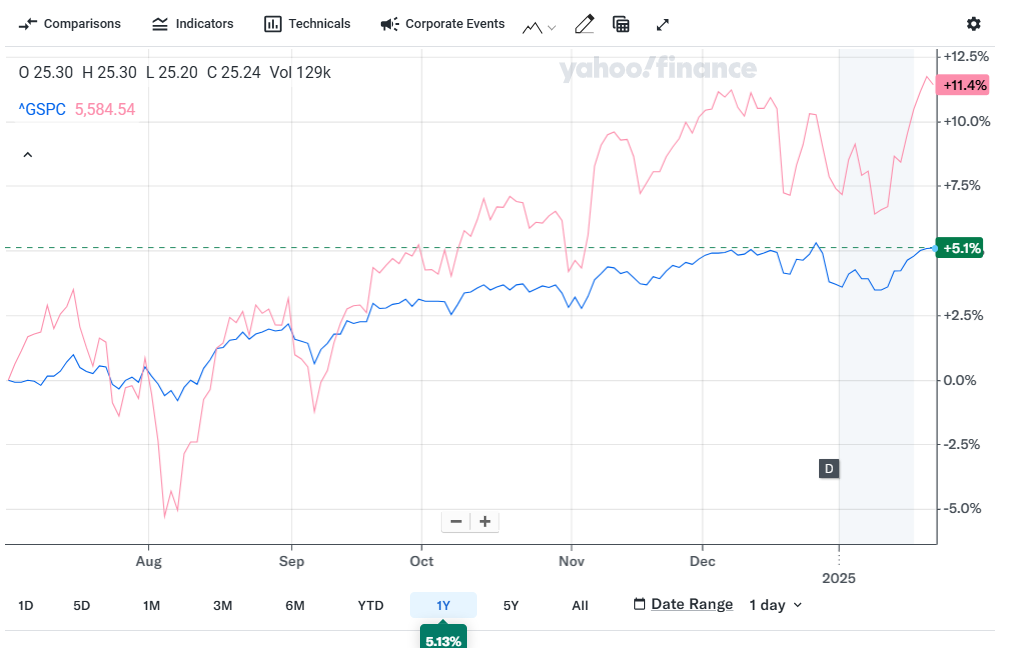
Historical Performance of Buffer Funds Relative to SPY and a 60/40 equity/bond portfolio
Many buffer funds have relatively short track records, so their performance results should be interpreted cautiously. However, analyzing their available data can provide insights into how they tend to perform relative to the broader market and a traditional 60/40 equity/bond portfolio. Below are three tables comparing the performance of various buffer funds to the SPDR S&P 500 ETF Trust (SPY) and a 60/40 mix of SPY and TLT (iShares 20+ Year Treasury Bond ETF) rebalanced monthly over different time periods. Note that not all funds were available for the longer time periods. Also included is a chart showing the daily price for MAXJ, the most conservative of the buffer funds mentioned in this article relative to SPY.
| Ticker | Total Return | Annualized Return | Annualized SD | Max Draw-down | Sharpe Ratio | Max Daily Gain | Max Daily Loss |
| SPY | 11.56% | 21.44% | 14.2% | 8.54% | 1.17 | 2.46% | -3.03% |
| 60/40 | 6.25% | 11.36% | 10.05% | 6.25% | 0.7 | 1.77% | -2.33% |
| MAXJ | 6.7% | 12.2% | 4.53% | 1.77% | 1.72 | 0.70% | -0.79% |
| IVVM | 9.42% | 17.32% | 8.98% | 5.39% | 1.42 | 1.59% | -2.35% |
| IVVB | 9.38% | 17.25% | 9.96% | 5.42% | 1.27 | 1.64% | -2.04% |
| BUFP | 7.56% | 13.81% | 6.8% | 4.11% | 1.37 | 1.22% | -1.75% |
| PBFR | 6.27% | 11.4% | 4.96% | 2.86% | 1.42 | 0.88% | -1.27% |
| BAUG | 9.51% | 17.5% | 8.97% | 3.99% | 1.44 | 1.70% | -1.90% |
| PAUG | 6.97% | 12.7% | 6.68% | 3.43% | 1.24 | 1.31% | -1.73% |
| UAUG | 7.42% | 13.54% | 6.3% | 2.75% | 1.44 | 1.16% | -1.51% |
| Total Return | Annualized Return | Annualized SD | Max Draw-down | Sharpe Ratio | Max Daily Gain | Max Daily Loss | |
| SPY | 42.13% | 30.27% | 12.52% | 8.54% | 2.01 | 2.46% | -3.03% |
| 60/40 | 23.25% | 17.03% | 10.53% | 6.25% | 1.51 | 2.05 | -2.33% |
| IVVM | 26.51% | 19.35% | 7.3% | 5.39% | 1,82 | 1.59% | -2.35% |
| IVVB | 27.47% | 20.03% | 8.4% | 5.42% | 1.82 | 1.64% | -2.04% |
| BAUG | 33.99% | 24.62% | 8.72% | 4.41% | 2.26 | 1.70% | -1.90% |
| PAUG | 25.53% | 18.65% | 6.53% | 3.48% | 2.14 | 1.31% | -1.73% |
| UAUG | 25.63% | 18.73% | 6.25% | 3.22% | 2.25 | 1.26% | -1.51% |
| Total Return | Annualized Return | Annualized SD | Max Draw-down | Sharpe Ratio | Max Daily Gain | Max Daily Loss | |
| SPY | 104.95% | 14.06% | 20.48% | 35.75% | 0.47 | 8.67% | -11.59% |
| 60/40 | 33.46% | 5.43% | 13.04% | 29.15% | 0.34 | 4.71% | -5.55% |
| BAUG | 71.94% | 10.44% | 14.38% | 25.41% | 0.43 | 6.44% | -9.00% |
| PAUG | 55.44% | 8.42% | 10.89% | 18.73% | 0.38 | 4.39% | -8.82% |
| UAUG | 44.44% | 6.97% | 8.64% | 14.16% | 0.32 | 4.11% | -6.47% |
- Returns vs. Risk:
- Short Term: In the short term (last 7 months), the 60/40 portfolio achieved good returns comparable to the buffer funds but with higher volatility. However, this is over a very short time period when bonds happened to experience somewhat of a recovery so not a representative example over a sufficiently long time to judge the performance.
- Long Term: Over longer periods, buffer funds provided better returns and lower volatility compared to the 60/40 portfolio. Especially the results in table 5 that where the performance period includes the year 2022, demonstrates how the equity/bond strategy did worse than a buffer fund strategy.
- Volatility and Drawdowns:
- Buffer Funds: Consistently showed lower volatility and smaller max drawdowns. Had the MAXJ fund been available in 2022 its performance would have really stood out during that time relative to a bond/equity strategy. I plan to write another blog back testing some of the buffer strategies over a longer period of time to be able to have more robust conclusions about their long-term performance.
- 60/40 Portfolio: Had higher volatility and drawdowns than buffer funds but lower than pure equity.
- Risk-Adjusted Performance:
- Sharpe Ratios: Buffer funds generally had higher or comparable Sharpe Ratios, indicating efficient risk-adjusted returns.
When Buffer Funds Could Be a Good Strategy
- Near-Retirement Investors:
- Profile: Individuals approaching retirement who want to protect their accumulated wealth while still participating in market gains.
- Why Buffer Funds Work: Buffer funds offer downside protection by absorbing a portion of market losses, which helps safeguard retirement savings from significant downturns.
- Risk-Averse Investors:
- Profile: Investors who are sensitive to market volatility and potential losses but still seek equity exposure.
- Why Buffer Funds Work: The built-in protection reduces the impact of negative market movements, providing peace of mind while allowing for some growth.
- Short-Term Goals Investors:
- Profile: Individuals investing for short- to medium-term goals, such as funding education, buying a home, or other significant expenses within a few years.
- Why Buffer Funds Work: They balance the need for growth with the desire to limit losses over shorter investment horizons.
- First-Time Equity Investors:
- Profile: New investors hesitant about entering the stock market due to fear of losses.
- Why Buffer Funds Work: They provide a gentler introduction to equities by offering a safety net against market declines.
- Investors Concerned About Market Corrections:
- Profile: Those who believe the market is overvalued and are wary of an impending correction but don’t want to miss out on potential gains.
- Why Buffer Funds Work: They allow participation in market upside while offering protection against a portion of potential losses.
When Buffer Funds Might Not Be Suitable
- Aggressive Growth Seekers:
- Profile: Investors aiming for maximum capital appreciation and willing to accept high risk.
- Why Buffer Funds May Not Work: Buffer funds often cap the upside potential to provide downside protection, limiting gains during strong market rallies.
- Long-Term Investors with High Risk Tolerance:
- Profile: Individuals with a long investment horizon who can withstand market volatility.
- Why Buffer Funds May Not Work: Over time, traditional equity investments may outperform due to uncapped growth and lower expense ratios, making buffer funds less attractive for maximizing long-term returns.
- Cost-Sensitive Investors:
- Profile: Those who prioritize low-cost investing strategies.
- Why Buffer Funds May Not Work: Buffer funds can have higher expense ratios due to the costs of providing downside protection, which may erode net returns.
- Sophisticated Investors Using Custom Strategies:
- Profile: Experienced investors who prefer to implement their own hedging or risk management strategies.
- Why Buffer Funds May Not Work: They might find buffer funds too restrictive and prefer more flexible, tailored approaches.
- Investors Unconcerned About Volatility:
- Profile: Those comfortable with market swings and focused on long-term growth.
- Why Buffer Funds May Not Work: The protective features may be unnecessary, and the capped upside could hinder overall portfolio performance.
Conclusion
Buffer funds offer a compelling alternative to the traditional equity/bond mix by providing downside protection and participation in market gains. Since their introduction in August 2018, they have grown significantly and are now offered by major asset managers like BlackRock and PGIM. While they come with slightly higher management fees compared to simple index funds, the benefits may outweigh the costs for many investors.
Given the limitations of bonds in recent market conditions, buffer funds can be particularly beneficial for those seeking to reduce risk without sacrificing returns. Alternatives like structured notes, annuities with guarantees, and option strategies exist but often require a higher level of investment knowledge and may not be as suitable for average retail investors due to complexity and potential risks. Low-volatility ETFs are more accessible but do not offer the explicit downside protection that buffer funds provide.
Before incorporating buffer funds or any alternative strategies into your portfolio, consult with a financial advisor to ensure they align with your overall financial strategy and risk tolerance.
Note: The information provided about specific funds is based on publicly available data as of the date of this article. Fund offerings, objectives, and expense ratios may change over time. Investors should refer to the latest fund prospectuses and consult financial professionals for the most current information.
Disclaimer: This article is for informational purposes only and does not constitute financial advice. Investment products mentioned may not be suitable for all investors. Always consult a qualified financial professional before making investment decisions.
5 responses to “Buffer Funds, An Alternative to Make Risk Management Easy”
-
The buffer funds have held up pretty well over the resent turmoil. Negative YTD return but less so than the overall market. PGIM have also introduced some new buffer funds recently :
PGIM Laddered Nasdaq-100 Buffer 12 ETF
Ticker Symbol: PBQQ
Buffer: Each part of the ladder comes with a 12% buffer protection and an upside limit of approximately 12%PGIM S&P 500 Max Buffer ETF Series
Ticker Symbols: PMJA (January), PMFB (February), PMMR (March), PMAP (April), PMMY (May), PMJN (June), PMJL (July), PMAU (August), PMSE (September), PMOC (October), PMNV (November), PMDE (December)Buffer: Each fund of the series comes with a 100% buffer protection (minus expenses of 0.5%) and an approximate upside limit of about 7%
-
This piece does more than just convey information; it opens up a space for contemplation and deeper thought.
-
Sweet website , super pattern, real clean and utilize friendly.
-
you have brought up a very great points, regards for the post.
-
I like this site very much so much wonderful information.
Leave a Reply